
Useful Concept for Medical/Healthcare Data Risk Prediction
Published:
This post is for explaining some basic statistical concepts used in disease morbidity risk prediction. As being a CS student, I have found a hard time figuring out these statistical concepts, hope my summary would be helpful for you.
Relative Risk vs Odds Ratio
Before explaining the concepts of these two terms, it is more fundamental to get clear with the following table, which is for calculating the above terms. ‘Disease’ contains two groups ( e.g. a person with certain disease, like CHD, or without CHD). ‘Exposure’: whether that person is exposed to certain risk factor (e.g. somking or no smoking; gender as male or female). Attention: 'Disease' can be regarded as 'Actual Class' in confusion matrix, but 'Exposure' is not equivalent to the 'Predicted Class'.
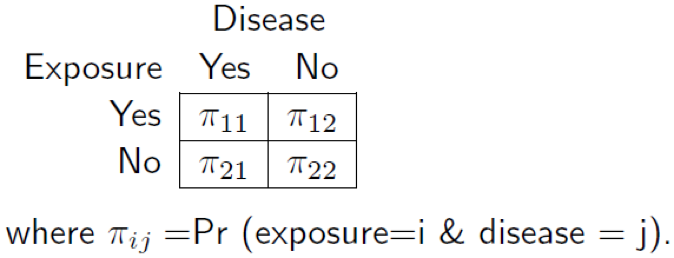
Figure 1. Disease & Exposure Table
Relative Risk, RR: also called as risk ratio, rate ratio, ‘is the ratio of the probability of an outcome in an exposed group to the probability of an outcome in an unexposed group’(referenced from Wiki). In my understanding, it means the ratio of probability that a CHD patient has smoking experience vs without smoking experience. In this sense, it becomes easy to interpret RR.
- RR = 1: the risk factor(smoking) has nothing to do with the probability that the person would suffer from CHD. After all, Pr(CHD|smoking) == Pr(CHD|non-smoking).
- RR > 1: meaning smoking is positively related with CHD, it’s a risk factor, the larger the value is, the more important the factor will be.
- RR < 1: the relationship between the two are negative, it can be viewed as a protect factor.
The formula is:

Odds: means given certain exposure condition(+/-), the ratio of probability of having disease vs not.
Odds Ratio, OR: is the ratio of odds vs odds, different from RR, which compares the intervention of an exposure to the disease group, OR views the comparison on both groups(disease, non-disease). Or to say the odds of having CHD with smoking habit is OR times the odds of having CHD without smoking. The OR value range can be interpreted in the same way as RR, while RR is more easily explanable.
OR is more widely used in studying the results of case/control group. RR is more suitable for prospective cohort study. When the base morbidity rate is significantly small(e.g. rare disease), especially , RR is approaching OR. Though odds and OR is not as easy interpretable as risks, it can be utilized to transfer linear function output into [0,1] value ranges for morbidity rate prediction(e.g. logistic regression, with 1 unit change in xj, the odds would change by a factor of exp(betaj), betaj is the coefficient of xj, detailed formula has been shown in my previous LR post).
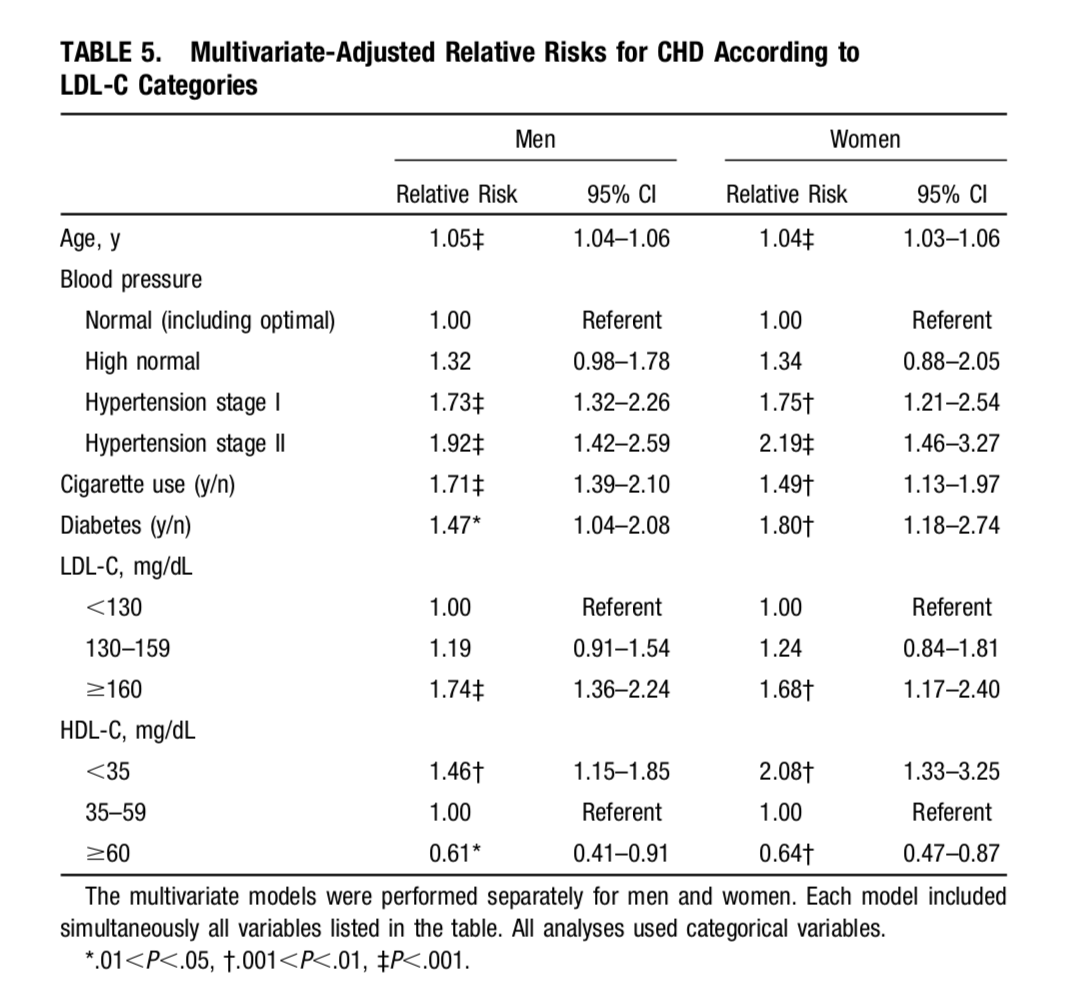
Interpret Predictor Importance Using RR/OR with Confidence Interval The table[3] below shows the RR and CI of different predictors for CHD morbidity prediction. To evaluate the importance of a predictor, both RR/OR and CI should be considered. For example, ‘Age’ is a significant postive factor to CHD, as its RR is above 1, with 95% CI lower bound also above 1. ‘Blood Pressure High normal’ is not a significant one, because its CI lower bound is smaller than 1, indicating its OR has the chance to be below 1.
Reference
[1]. https://en.wikipedia.org/wiki/Risk_ratio
[2]. https://www.ncbi.nlm.nih.gov/pmc/articles/PMC1112884/
[3]. Peter W. F. Wilson, Ralph B. Prediction of Coronary Heart Disease Using Risk Factor Categories. AHA (1524-4539). doi: 10.1161/01.CIR.97.18.1837
[4]. http://www.medsci.cn/article/show_article.do?id=f22e1920083
[5]. https://www.mdedge.com/jfponline/article/65515/relative-risks-and-odds-ratios-whats-difference

Leave a Comment